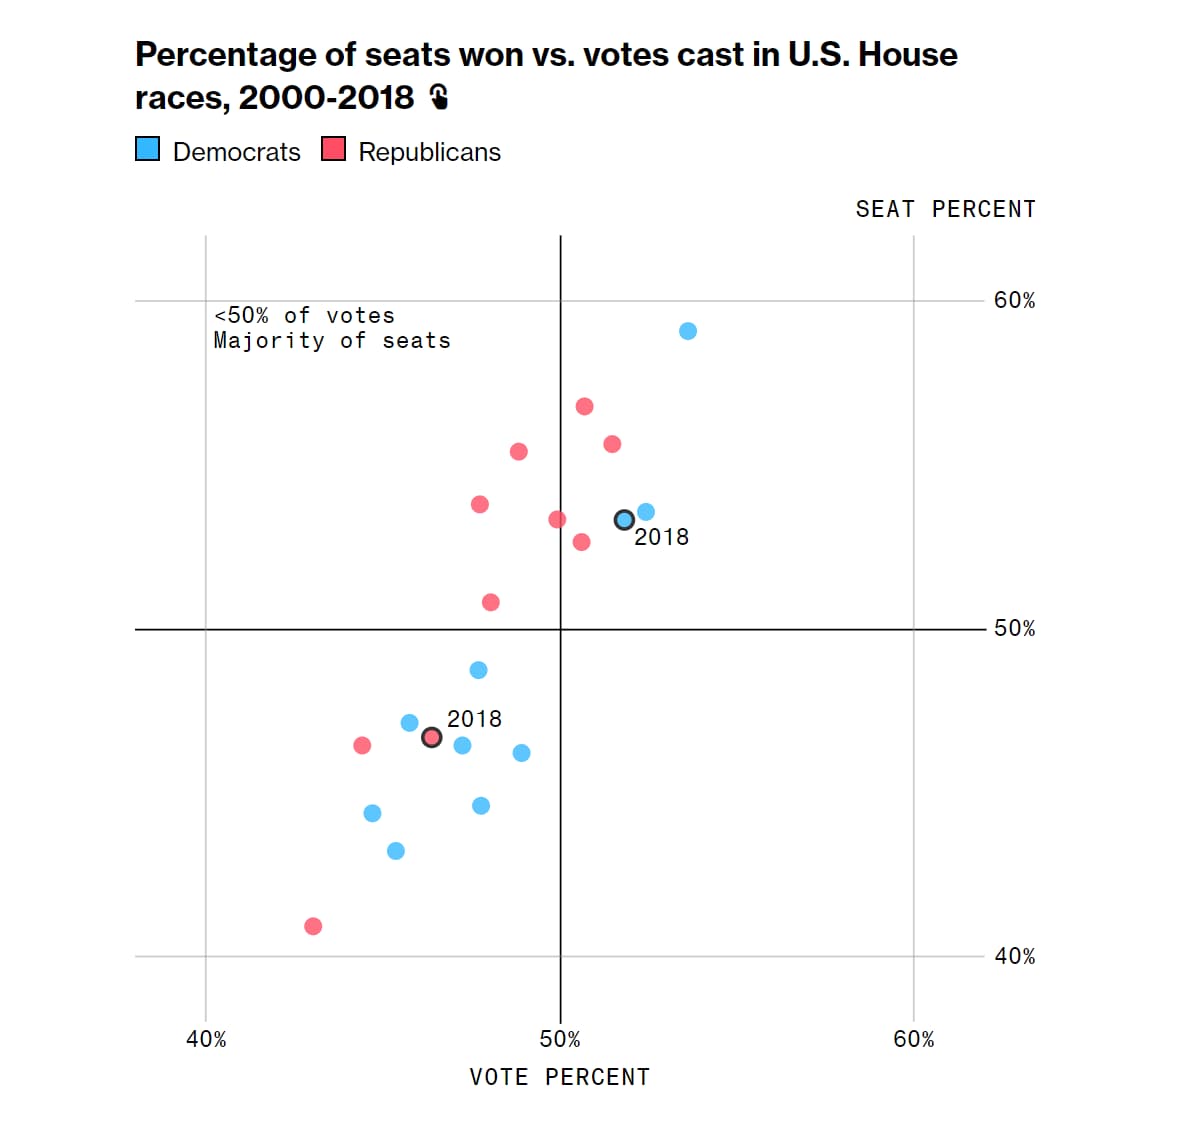
 This piece is about the difference between the percentage of House seats won and the percentage of House votes cast for Democrats and Republicans in the 2018 election—and, more specifically, how gerrymandered district maps have helped Republicans win a disproportionate number of House seats in most elections since 2000. It looks at election data from the past 18 years to examine the "representation gap" for each election, what we dubbed the percentage-point gap between the share of House seats vs. votes won in a particular party's favor.